How to Calculate Cost of Goods Sold (COGS): Complete Guide
If you sell physical products or manufacture goods, understanding your Cost of Goods Sold (COGS) isn't optional—it's essential. This single metric determines your gross profit, impacts your tax liability, and reveals whether your pricing strategy is sustainable.
Yet many business owners either miscalculate COGS or miss valuable deductions because they don't fully understand what should be included. According to recent analysis by the Financial Accounting Standards Board's Investor Advisory Committee, COGS can account for up to 70% of a company's expenses on its income statement.
This guide breaks down exactly how to calculate COGS, which inventory valuation method to use, and how to leverage this metric to make smarter business decisions.
What Is Cost of Goods Sold (COGS)?
Cost of Goods Sold represents all direct costs associated with producing or acquiring the goods your business sells during a specific period. These are expenses directly tied to creating your product—not the overhead costs of running your business.
COGS includes:
- Raw materials: Components and supplies used in manufacturing
- Direct labor: Wages for employees directly involved in production
- Manufacturing overhead: Factory utilities, equipment depreciation, production facility costs
- Purchased inventory: Wholesale costs of goods bought for resale
- Freight-in costs: Shipping charges to get inventory to your facility
COGS appears on your income statement directly below revenue and is subtracted from total sales to calculate gross profit. This makes it one of the most critical metrics for understanding your business's core profitability.
What COGS Does NOT Include
It's equally important to understand what doesn't qualify as COGS:
- Administrative salaries and management compensation
- Marketing and advertising expenses
- Sales team salaries and commissions
- Office rent and utilities (unless part of production facility)
- Distribution costs to ship finished products to customers
- Research and development costs
These expenses are classified as operating expenses (OpEx) and appear separately on your financial statements.
Why COGS Matters for Your Business
Tax Deductions That Lower Your Bill
COGS is a tax-deductible business expense that directly reduces your taxable income. Businesses with average gross receipts under $31 million for the three years prior to the tax year can benefit significantly from properly calculating COGS.
The higher your COGS, the lower your reported profits—and consequently, your tax liability. This makes accurate COGS calculation essential for maximizing legitimate tax savings.
Profitability Analysis
Your gross profit margin—calculated as (Revenue - COGS) ÷ Revenue—reveals how efficiently you produce or acquire products. A healthy gross margin typically ranges from 35-65% depending on your industry, though this varies widely.
If your gross margin is shrinking, you'll know immediately that production costs are eating into profitability, signaling a need to renegotiate supplier contracts, streamline manufacturing, or adjust pricing.
Pricing Strategy Foundation
You can't set profitable prices without knowing your true product costs. COGS provides the baseline—the minimum you must charge to break even on production. Strategic pricing adds a markup to cover operating expenses and generate profit.
Many businesses make the mistake of pricing based solely on competitor analysis without understanding their own cost structure. This approach leads to unsustainable margins and eventual cash flow problems.
Inventory Management Insights
Tracking COGS helps you identify slow-moving inventory, seasonal fluctuations, and products with the highest profit margins. This data informs purchasing decisions and helps you avoid tying up excessive capital in unsold goods.
The COGS Formula: Step-by-Step Calculation
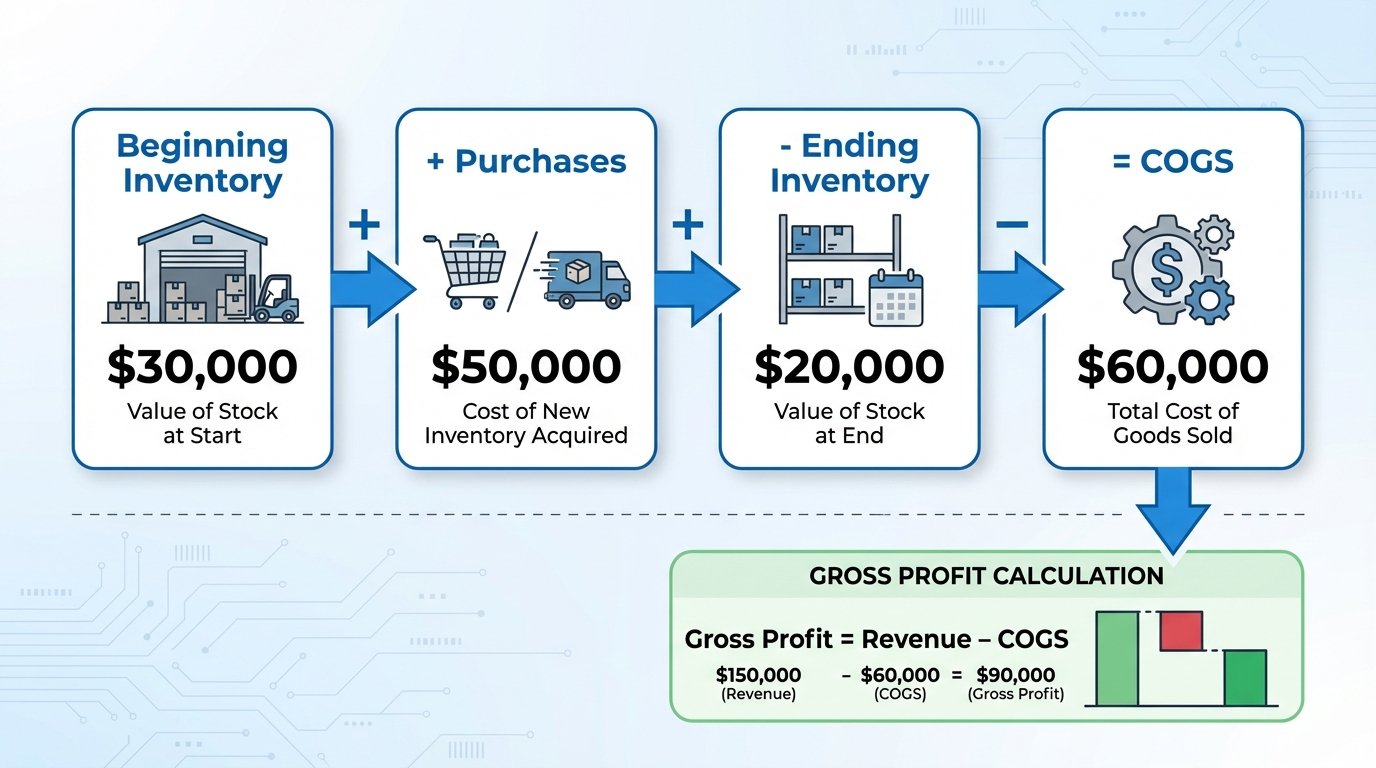
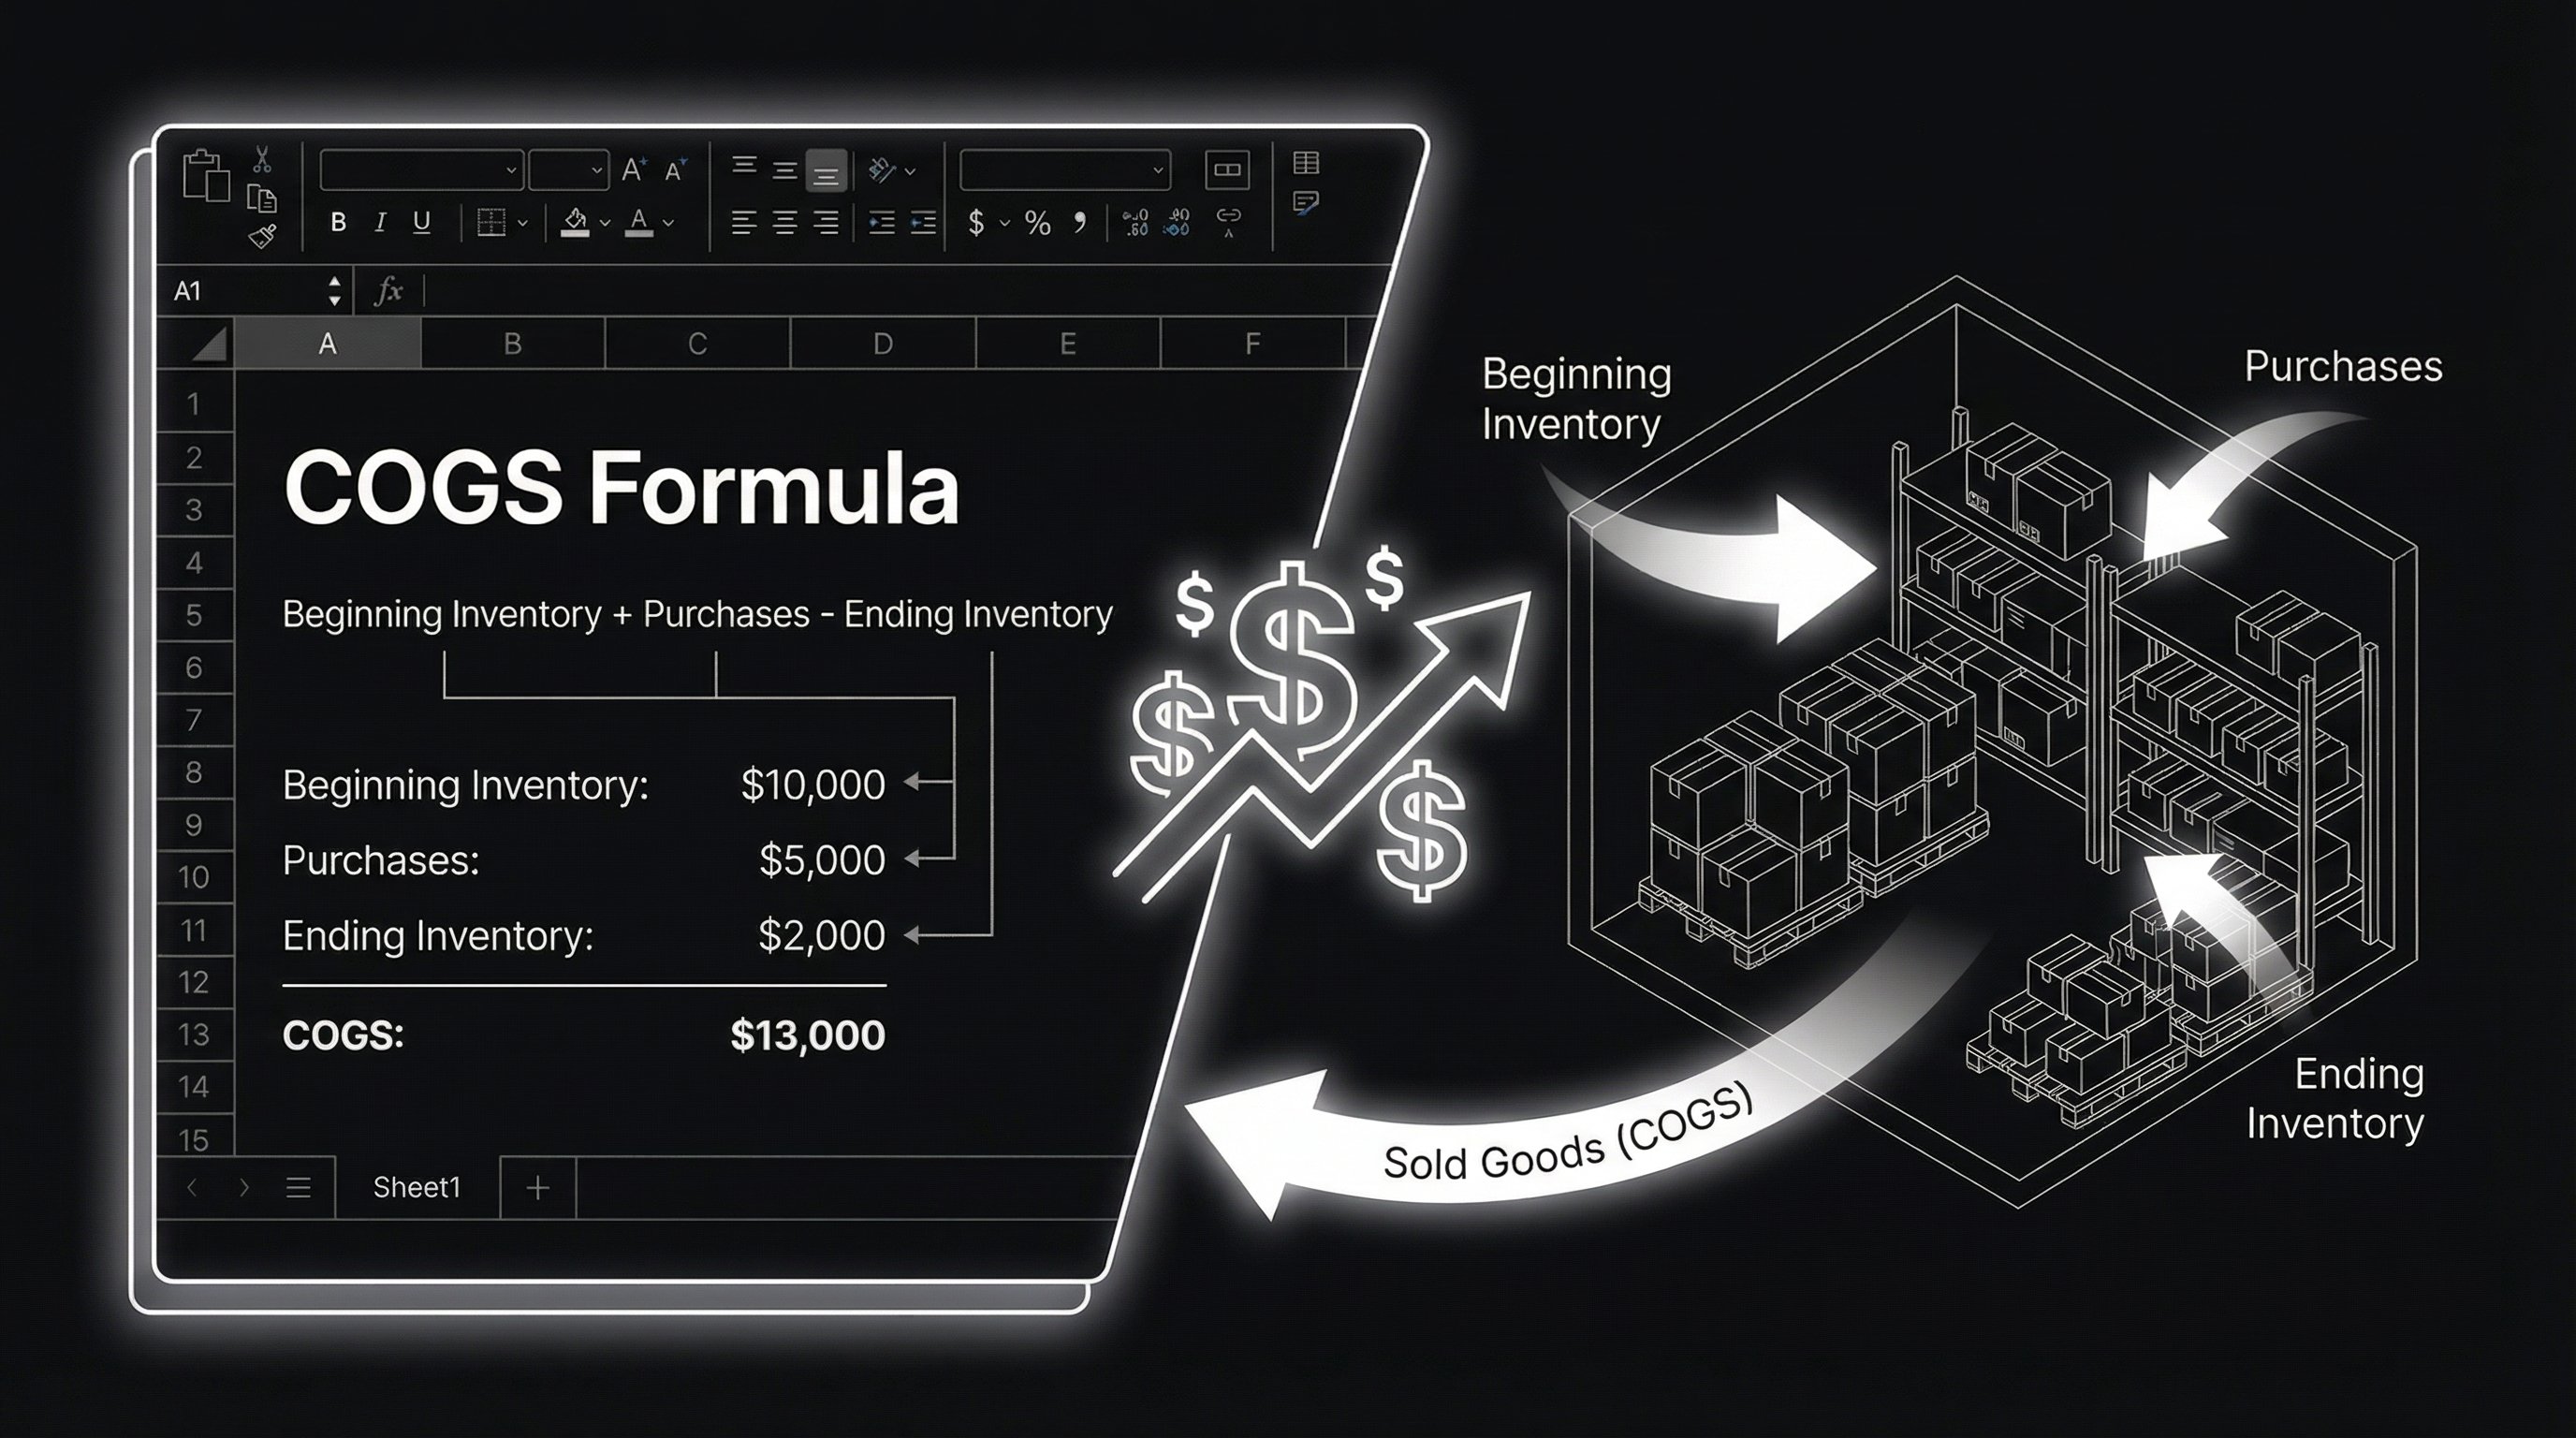
The standard formula for calculating Cost of Goods Sold is:
COGS = Beginning Inventory + Purchases - Ending Inventory
Let's break down each component:
Beginning Inventory
This is the total value of all inventory you had on hand at the start of the accounting period (typically a quarter or fiscal year). It includes:
- Finished products ready for sale
- Raw materials
- Work-in-progress (partially completed goods)
- Any supplies that become part of the finished product
Your beginning inventory for this period should match the ending inventory from your previous period.
Purchases
This represents all inventory-related costs incurred during the period, including:
- Cost of raw materials purchased
- Wholesale price of finished goods acquired for resale
- Freight and shipping costs to receive inventory
- Direct labor costs for manufacturing
- Manufacturing supplies and overhead directly tied to production
Do not include inventory purchased with personal funds or items not intended for sale.
Ending Inventory
The value of all unsold inventory remaining at the end of the accounting period. This requires conducting a physical inventory count and valuing those items using your chosen inventory valuation method.
Ending inventory can include:
- Unsold finished goods
- Remaining raw materials
- Work-in-progress items
- Damaged or obsolete goods (valued appropriately)
Real-World COGS Calculation Examples
Example 1: Retail Clothing Store
A boutique clothing store has the following data for Q1:
- Beginning Inventory: $30,000
- Purchases During Q1: $50,000
- Ending Inventory: $20,000
COGS Calculation:
COGS = $30,000 + $50,000 - $20,000 = $60,000
This means the store spent $60,000 on the clothing inventory it actually sold during the quarter.
Example 2: Furniture Manufacturer
A furniture manufacturer has these figures for the month:
- Beginning Inventory (raw materials): $50,000
- Raw Material Purchases: $30,000
- Direct Labor: $15,000
- Manufacturing Overhead: $8,000
- Ending Inventory: $20,000
COGS Calculation:
COGS = $50,000 + ($30,000 + $15,000 + $8,000) - $20,000 = $83,000
The manufacturer's cost to produce the furniture sold this month was $83,000.
Example 3: Restaurant
A restaurant tracks these costs for the month:
- Beginning Food Inventory: $8,000
- Food Purchases: $70,000
- Ending Food Inventory: $7,000
COGS Calculation:
COGS = $8,000 + $70,000 - $7,000 = $71,000
The restaurant spent $71,000 on ingredients for meals served to customers.
Inventory Valuation Methods: FIFO, LIFO, and Weighted Average
The method you use to value inventory significantly impacts your COGS calculation and tax liability. Here are the three most common approaches:
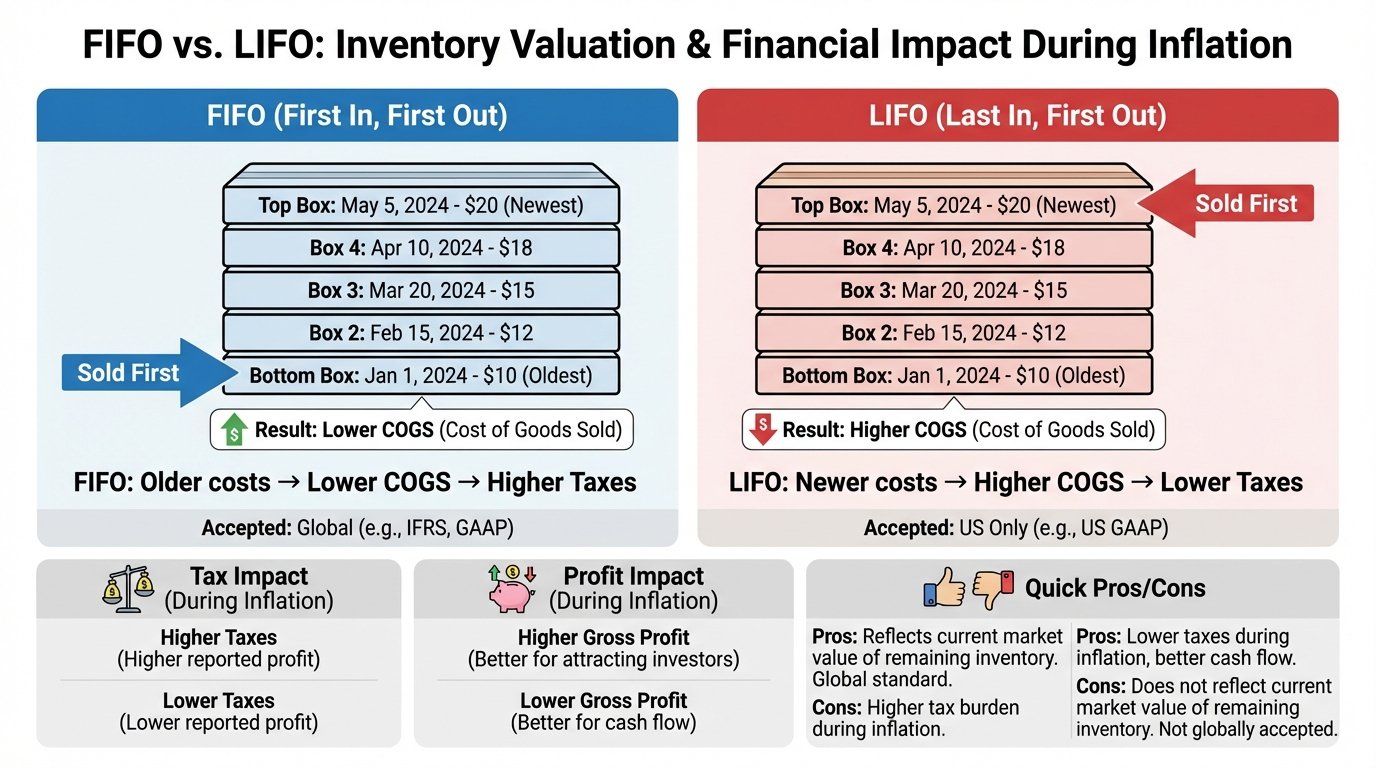
FIFO (First In, First Out)
How it works: Assumes the oldest inventory items are sold first.
Best for: Businesses with perishable goods (food, pharmaceuticals) or products with short shelf lives.
Tax implications: During inflation, FIFO results in lower COGS and higher reported profits, leading to higher taxes. However, it provides a more accurate representation of current inventory value on your balance sheet.
Example: You purchased 100 units at $10 each, then 100 more at $12 each. When you sell 100 units using FIFO, your COGS is $1,000 (100 × $10), leaving newer inventory valued at $1,200 on your balance sheet.
LIFO (Last In, First Out)
How it works: Assumes the newest inventory is sold first.
Best for: Non-perishable goods during inflationary periods when you want to minimize taxable income.
Tax implications: LIFO results in higher COGS and lower reported profits during inflation, reducing tax liability. However, it's only permitted under US GAAP, not IFRS, limiting its use for international companies.
Example: Using the same scenario, selling 100 units under LIFO gives you COGS of $1,200 (100 × $12), leaving older inventory valued at $1,000 on your balance sheet.
Important note: According to recent CPA Journal analysis, LIFO can reduce tax liability by approximately $1 billion annually across companies that use it, but requires careful compliance with IRS regulations.
Weighted Average Cost
How it works: Calculates the average cost of all units available for sale and applies that average to units sold.
Best for: Businesses with large quantities of similar, non-perishable items where tracking individual unit costs is impractical.
Tax implications: Falls between FIFO and LIFO, providing moderate tax effects.
Example: You have 100 units at $10 and 100 at $12. Average cost = ($1,000 + $1,200) ÷ 200 = $11 per unit. Selling 100 units gives COGS of $1,100.
| Method | During Inflation | Tax Impact | Balance Sheet Inventory | Accepted Standards |
|---|---|---|---|---|
| FIFO | Lower COGS, Higher Profits | Higher Taxes | Current Market Value | GAAP & IFRS |
| LIFO | Higher COGS, Lower Profits | Lower Taxes | Understated Value | GAAP Only (US) |
| Weighted Average | Moderate COGS | Moderate Taxes | Average Value | GAAP & IFRS |
COGS vs Operating Expenses: Understanding the Difference
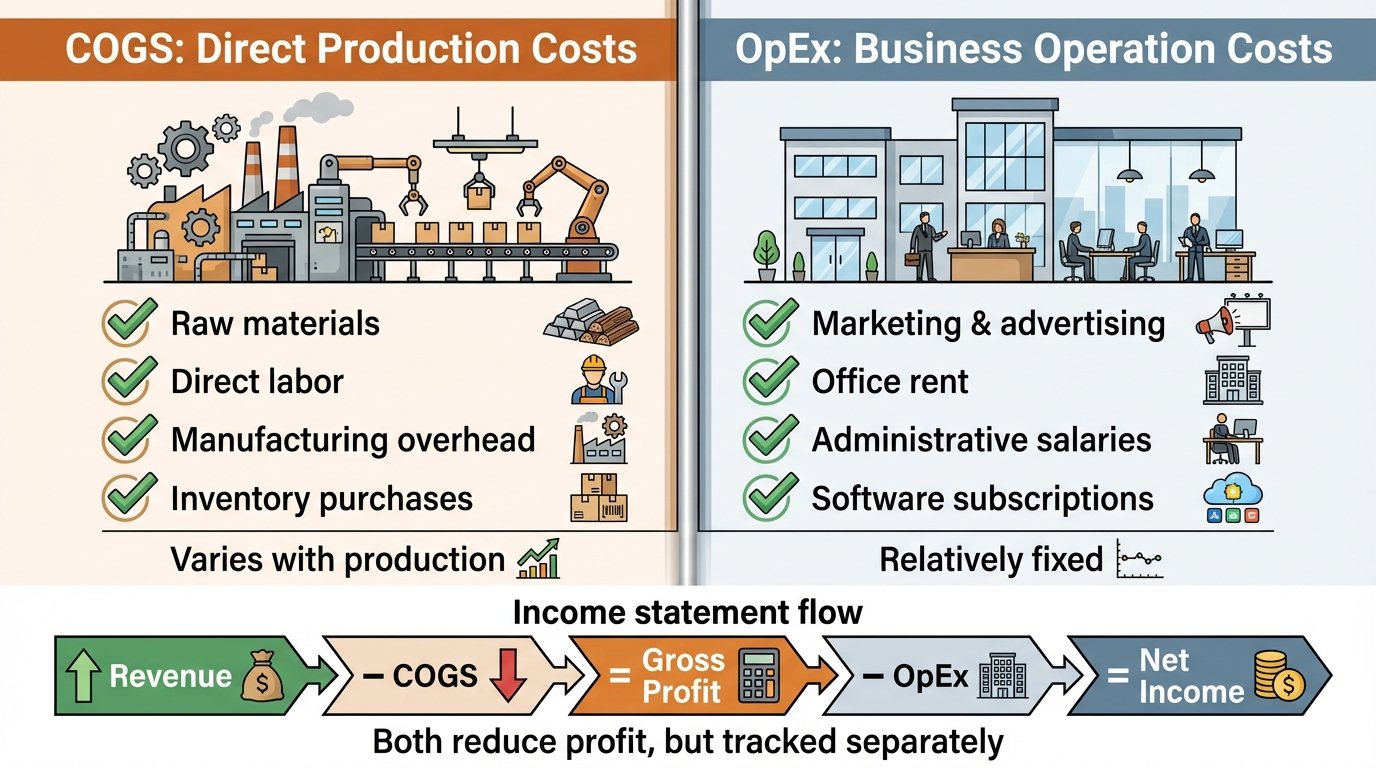
Confusing COGS with operating expenses is one of the most common accounting mistakes small businesses make.
COGS = Direct costs that vary with production volume Operating Expenses (OpEx) = Indirect costs that remain relatively fixed
COGS Examples
- Raw materials for manufacturing
- Wholesale product purchases
- Factory worker wages
- Production facility utilities
- Packaging materials
Operating Expense Examples
- Marketing and advertising
- Administrative salaries
- Office rent
- Professional services (legal, accounting)
- Software subscriptions (not directly tied to production)
On your income statement:
- Revenue
-
- COGS
- = Gross Profit
-
- Operating Expenses
- = Operating Income
This separation is critical because it shows you two different types of efficiency: production efficiency (COGS) and operational efficiency (OpEx).
How to Calculate COGS for Different Business Types
Manufacturing Businesses
Manufacturers have the most complex COGS calculations because they must track multiple inventory accounts:
- Raw materials inventory
- Work-in-progress inventory
- Finished goods inventory
Formula: Beginning Finished Goods + Cost of Goods Manufactured - Ending Finished Goods
Where Cost of Goods Manufactured = Raw Materials Used + Direct Labor + Manufacturing Overhead
Retail Businesses
Retailers use the standard formula focusing on merchandise inventory:
COGS = Beginning Inventory + Purchases - Ending Inventory
Purchases should include the wholesale cost plus freight charges to receive goods.
Service Businesses
Most service businesses don't have traditional COGS because they don't sell physical products. However, if your service requires materials or has direct costs tied to service delivery, you might track "Cost of Services" similarly:
- Direct labor costs for billable hours
- Materials consumed during service delivery
- Subcontractor costs for specific client projects
Note: For tax purposes, personal service businesses (consultants, lawyers, etc.) typically don't report COGS. These direct costs are reported as regular business expenses instead.
Common COGS Calculation Mistakes to Avoid
1. Including Operating Expenses in COGS
Your office rent, marketing costs, and administrative salaries don't belong in COGS. Only include costs directly tied to producing or acquiring the goods you sold.
2. Forgetting to Conduct Physical Inventory Counts
Your accounting system's inventory numbers aren't always accurate. Shrinkage, damage, and theft happen. Physical counts ensure your ending inventory—and therefore COGS—is correct.
3. Inconsistent Valuation Methods
Once you choose FIFO, LIFO, or weighted average, you must apply it consistently. Switching methods requires IRS approval and specific accounting adjustments.
4. Not Capitalizing All Eligible Costs
Under uniform capitalization (UNICAP) rules, certain overhead costs must be included in COGS for tax purposes, including storage, purchasing, processing, and handling costs. Missing these can result in overstated profits and higher taxes.
5. Misclassifying Labor Costs
Production workers = COGS. Administrative staff = Operating Expenses. The line isn't always clear, so document your classification criteria carefully.
How to Reduce Your COGS Without Sacrificing Quality
Lowering COGS directly increases your gross profit margin. Here are proven strategies:
Negotiate Better Supplier Terms
If you've been a reliable customer, suppliers often offer volume discounts, extended payment terms, or lower pricing to retain your business. Review contracts annually and shop around for competitive bids.
Optimize Your Supply Chain
Inefficiencies in your supply chain add unnecessary costs. Consider:
- Consolidating suppliers to reduce freight costs
- Implementing just-in-time inventory to minimize storage
- Automating repetitive production tasks
- Reducing material waste through better training
Review Your Product Mix
Not all products are equally profitable. Calculate COGS by product line to identify which items have the highest margins. Consider discontinuing low-margin products or finding ways to produce them more efficiently.
Improve Inventory Management
Excess inventory ties up capital and increases storage costs. Inventory that sits too long may become obsolete or damaged, forcing write-downs. Use inventory management software to track turnover rates and optimize ordering.
PineBill's inventory features help you track product costs, monitor stock levels, and generate reports that show exactly which products drive the most profit—giving you the data you need to make informed decisions.
Implement Preventive Maintenance
For manufacturers, equipment downtime increases labor costs and delays production. Regular maintenance prevents expensive repairs and keeps production efficient.
COGS and Tax Reporting: What You Need to Know
COGS is reported differently depending on your business structure:
Sole Proprietors and Single-Member LLCs
Form: Schedule C (Profit or Loss From Business)
Section: Part III calculates COGS, which then flows to Part I (Income) to determine gross profit.
You'll need to provide:
- Inventory valuation method
- Beginning and ending inventory values
- Purchases and cost of items withdrawn for personal use
- Labor, materials, and overhead costs (if manufacturing)
Partnerships and Multi-Member LLCs
Form: Form 1065 (U.S. Return of Partnership Income) with Form 1125-A attached
Form 1125-A is specifically for calculating Cost of Goods Sold and requires detailed breakdowns of all COGS components.
C Corporations and S Corporations
Forms: Form 1120 or Form 1120-S with Form 1125-A attached
The same detailed COGS calculation applies.
Small Business Exception
Businesses with average annual gross receipts under $31 million (as of 2025) may qualify for simplified accounting methods and exceptions to complex inventory capitalization rules. Consult your tax advisor to determine if you qualify.
COGS Benchmarks by Industry
Understanding typical COGS percentages helps you gauge whether your costs are in line with industry standards:
| Industry | Typical COGS as % of Revenue |
|---|---|
| Restaurants | 25-35% |
| Retail Clothing | 40-60% |
| Manufacturing | 50-65% |
| Grocery Stores | 65-75% |
| Software (Physical Products) | 15-25% |
| Wholesale Distribution | 70-85% |
Important: These are general guidelines. Your specific COGS percentage depends on your business model, pricing strategy, and operational efficiency.
If your COGS falls outside the typical range for your industry:
- Too high: Look for cost reduction opportunities or consider raising prices
- Too low: Verify you're capturing all direct costs correctly, or confirm your pricing is competitive
Key Takeaways
-
COGS includes only direct production costs—raw materials, direct labor, and manufacturing overhead. Operating expenses are separate.
-
The formula is straightforward: Beginning Inventory + Purchases - Ending Inventory = COGS. The complexity lies in accurate inventory tracking and valuation.
-
Choose the right inventory method: FIFO, LIFO, and weighted average each have different tax implications. FIFO is most common and accepted internationally, while LIFO can reduce taxes during inflation but only in the US.
-
COGS is tax-deductible and directly reduces your taxable income. Proper calculation can save thousands in taxes annually.
-
Monitor your gross margin: Revenue minus COGS reveals your core profitability before operating expenses. Healthy margins vary by industry but typically range from 35-65%.
-
Conduct physical inventory counts regularly to ensure accuracy and identify shrinkage, damage, or accounting errors.
-
Use automation: Accounting software eliminates manual calculations, reduces errors, and provides real-time insights into product profitability.